What Is LLM Visibility? Definition, Measurement, and 2026 Benchmarks
Read the postDateApr 14, 2026
CategoryResearch

Attribution in AI search does not work like attribution in traditional search. There is no Search Console for LLMs. There are no impression logs, no click-through rates, no referral headers from most AI platforms. And yet, companies are making real budget decisions based on AI visibility. The question is whether those decisions are grounded in evidence or guesswork. We think the answer can be evidence, if you measure the right things.
TL;DR
GEO attribution requires a three-layer approach: simulated visibility (daily SOV tracking), crawler verification (server log analysis), and referral/lift attribution (GA4 + branded search). No single layer is sufficient alone. Together, they provide evidence-based measurement that can justify real investment decisions.

In traditional search, the attribution model is relatively clean. A user types a query into Google, clicks a result, lands on your site, and Google Analytics records the referral source, the landing page, and the conversion path. You can trace a revenue event back to a keyword.
AI search breaks almost every step in that chain. When someone asks ChatGPT "What is the best CRM for a 50-person team?" and gets a synthesized answer that recommends your product, there is often no click, no referral header, and no analytics event. The buyer may take that recommendation, go directly to your website by typing your URL, and convert. In your analytics, that shows up as direct traffic. The AI recommendation that caused the visit is invisible.
This is what Rand Fishkin at SparkToro calls "dark traffic". Between Apple cookie changes, ad blocker adoption above 40%, multi-device journeys, and AI-synthesized answers, a growing share of your most valuable traffic has no traceable origin. Google now answers nearly two-thirds of all queries without generating a click to external sites. AI chatbots take this further by synthesizing answers from multiple sources, often without linking to any of them.
The result is that traditional attribution models undercount AI-driven demand. If you wait for referral data to show up in Google Analytics before investing in AI visibility, you will be late. The signal is real. The measurement just requires a different approach.
Attribution in AI search cannot rely on a single signal. No individual metric tells the full story. What works is a layered approach where each signal reinforces the others, building a picture of causation that no single data point can provide alone.
We think about GEO attribution as three distinct layers, each with different latency, reliability, and actionability.
Run daily queries against actual AI chat interfaces to track Share of Voice, sentiment, and positioning changes. Provides immediate feedback before any traffic signal appears. This is the earliest signal available and the most actionable.
Analyze server logs for official AI crawler user agents: GPTBot, ClaudeBot, PerplexityBot, GoogleOther, OAI-SearchBot. Track crawl frequency, which pages get crawled most, and how crawl patterns change after content updates. Confirms that AI systems are ingesting your content.
Use GA4 regex filters to detect AI-referred traffic from Perplexity, ChatGPT search, and Copilot. Correlate changes in direct traffic and branded search volume with SOV improvements. Apply lift-based testing where possible.
No single layer is sufficient on its own. Layer 1 tells you what AI models are saying about you today. Layer 2 confirms that AI systems are actively crawling and indexing your content. Layer 3 measures whether that visibility is reaching real buyers. Together, they form a causal chain that can justify investment decisions with evidence.
There is a reasonable skepticism about GEO metrics. If you cannot tie a specific revenue event to a specific AI mention, is the metric meaningful? We think the answer is yes, and the reasoning comes from how marketers already treat other high-impact channels that lack clean attribution.
Brand advertising has always had an attribution gap. You cannot trace a specific billboard view to a specific purchase. But marketers have spent decades investing in brand because the evidence shows it works: brand awareness correlates with market share, purchase intent, and pricing power. The Binet and Field research showed that brands with Share of Voice exceeding their Share of Market tend to grow, and vice versa. SOV is a leading indicator of market share change. Nobody calls that a vanity metric.
AI Share of Voice works on the same principle, applied to a new channel. The data supporting its importance is mounting rapidly.
| Evidence Point | Finding | Source |
|---|---|---|
| AI-referred conversion rate | 4.4x higher than traditional organic search | Industry benchmarks, 2025 |
| AI traffic growth rate | 2-6% of organic traffic, growing 40%+ monthly | Averi, 2026 |
| Traditional search decline | 25% volume drop predicted by 2026 | Gartner, 2024 |
| AI influence on B2B shortlists | #1 source influencing vendor shortlists | G2 Buyer Behavior, 2025 |
| Earned media in AI citations | 69-82% of AI citations come from third-party mentions | Chen et al., U of Toronto, 2025 |
| GEO measurement adoption | Only 23% of marketers currently invest in prompt tracking | Industry survey, 2025 |
When AI-referred visitors convert at 4.4x the rate of traditional organic, and AI chatbots are now the primary influence on B2B vendor shortlists, the channel is too large to ignore because the attribution is imperfect. Perfect attribution has never been a prerequisite for smart investment. Evidence-based estimation has always been enough.
The question is whether you are estimating with rigor or flying blind. That distinction is what separates evidence-based GEO measurement from vanity metrics.
Attribution difficulty does not mean attribution impossibility. Several concrete signals are available right now, and combining them produces a reasonable picture of AI-driven business impact.
Your server logs capture 100% of bot requests. Google Analytics cannot see AI crawlers, but your access logs can. By filtering for known user agent strings, you can track exactly which AI systems are crawling your content, how often, and which pages they prioritize.
| AI Crawler | Operator | Primary Function | Drives Referral Traffic? |
|---|---|---|---|
| GPTBot | OpenAI | Training data collection | Indirect |
| OAI-SearchBot | OpenAI | ChatGPT search retrieval | Yes, via citations |
| ClaudeBot | Anthropic | Training data collection | Indirect |
| PerplexityBot | Perplexity | Real-time search retrieval | Yes, via source links |
| GoogleOther | AI Overview and Gemini retrieval | Yes, via AI Overviews |
A spike in PerplexityBot crawl frequency on your pricing page, followed by an increase in direct traffic to that same page, is a strong correlational signal. It does not prove causation on its own. But combined with Layer 1 SOV data showing increased Perplexity mentions, the evidence becomes compelling.
Some AI platforms do generate trackable referral traffic. Perplexity links to source websites when it answers queries. ChatGPT search (via OAI-SearchBot) produces citations. Google AI Overviews link to source pages. You can set up GA4 regex filters to capture traffic from these sources and track it as a distinct channel.
The catch is that this captures only a fraction of AI-influenced visits. A buyer who reads a ChatGPT recommendation and then types your brand name into Google will show up as organic branded search, not AI referral. A buyer who goes directly to your URL shows up as direct. The referral data is real but incomplete.
One of the most underused attribution signals is branded search volume. If your AI SOV increases and your branded search volume increases in the same period, that correlation is meaningful. Buyers who hear about you through AI often validate the recommendation by searching for your brand name on Google. That behavior creates a measurable signal in Google Search Console.
This is analogous to how marketers have always measured TV and podcast advertising impact: you cannot trace a specific ad view to a specific purchase, but you can measure the branded search lift that follows a campaign. AI visibility works the same way.
The strongest attribution approach we have seen is switchback testing. Optimize your content for GEO in one product category while leaving a comparable category untouched. Track SOV, crawler activity, branded search, and conversion rates for both. If the optimized category shows meaningful improvement across all layers while the control does not, the causal inference is strong. This is the same experimental design used in offline advertising measurement and in ride-sharing pricing experiments. It is not perfect, but it is rigorous enough to support budget decisions.
The reason attribution matters is that real money is at stake. Companies are making budget allocation decisions right now about whether and how much to invest in AI visibility. Those decisions should be grounded in evidence, and the evidence is increasingly clear.
Gartner predicted that traditional search engine volume would drop 25% by 2026 as users shift to AI chatbots. That migration is already underway. SparkToro and Datos research shows AI tool usage has nearly tripled in the past year, and the growth rate is accelerating.
If 25% of your search traffic migrates to AI channels over the next two years, and you have no visibility in those channels, you are not just missing a new opportunity. You are losing ground you already held. The cost of inaction is measurable: it is 25% of your current search-driven pipeline, compounding over time as AI adoption grows.
Meanwhile, companies that invest in AI visibility now are capturing a channel where only 23% of marketers are currently active. The competition is thin. The conversion rates are high. And the brands that build SOV early will have a compounding advantage as the channel matures, just as early SEO adopters did in the 2000s.
We hear the same concerns from marketing leaders evaluating GEO investment. Each one is reasonable on its surface. Each one has a clear counterargument.
| Objection | Why It Falls Short |
|---|---|
| "We cannot attribute revenue to AI mentions" | You cannot attribute revenue to billboards or podcasts either. SOV as a leading indicator of market share is a well-established framework (Binet & Field). AI SOV follows the same logic with stronger conversion data. |
| "AI traffic is too small to matter" | AI traffic is 2-6% of organic and growing 40%+ monthly. At current growth rates, AI tool usage is doubling annually (SparkToro/Datos). Waiting until the channel is large means competing against established incumbents. |
| "LLM outputs are non-deterministic" | True. That is why point-in-time snapshots are insufficient and daily monitoring with trend analysis over time is necessary. Statistical significance comes from sample size, not from individual query consistency. |
| "There is no standard for GEO measurement" | There was no standard for SEO measurement in 2004 either. The brands that built measurement frameworks early defined the standard that others adopted later. |
The pattern is consistent across marketing history. New channels always start with imperfect measurement. The companies that invest anyway, using the best available evidence, gain the first-mover advantage. The companies that wait for perfect attribution miss the window.
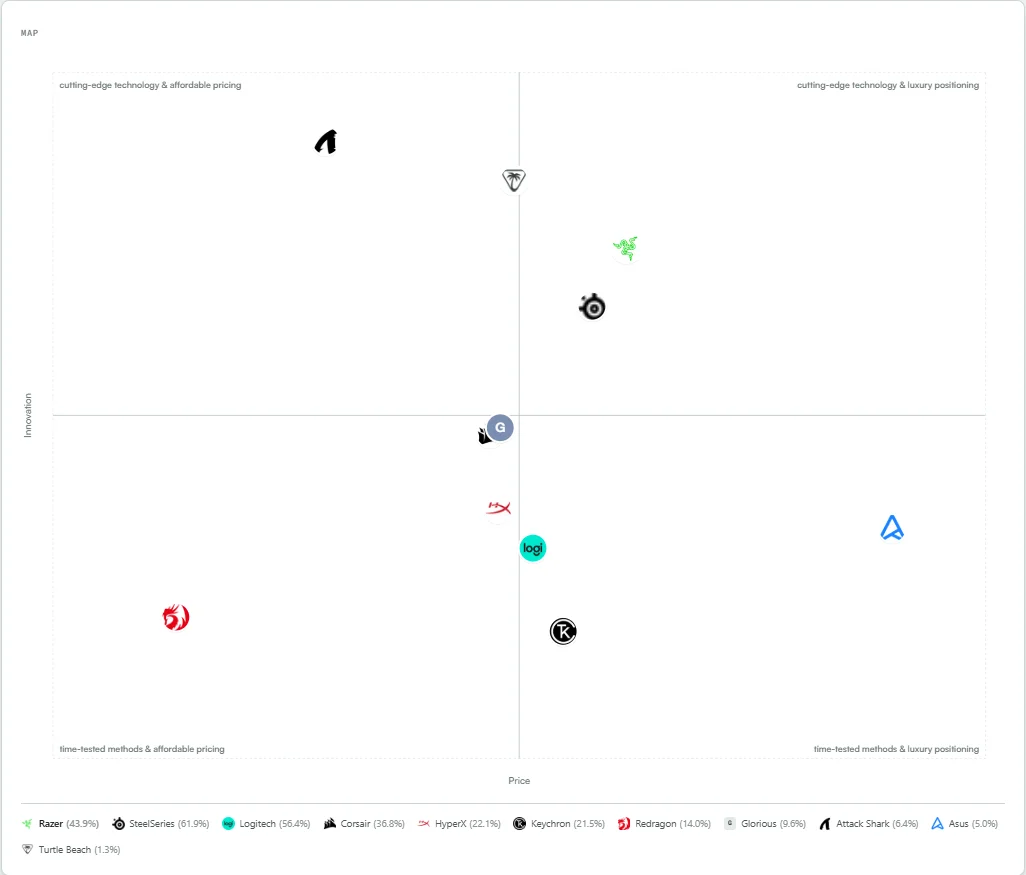
We built Sill to provide the leading-indicator layer that GEO attribution requires. Our monitoring dashboard queries the actual chat interfaces of ChatGPT, Perplexity, Gemini, Google AI Overviews, Copilot, and Grok daily, with web search enabled and citations included. This means we measure what real buyers see, not an API approximation that skips retrieval-augmented generation.
We track three core metrics that together form the foundation of GEO attribution:
The attribution loop works like this: you make a content change (adding statistics, restructuring for answer capsules, increasing off-site mentions). You watch the SOV and Semantic Map for movement. If your SOV increases and your position shifts in the direction you intended, the intervention worked. If it did not, you iterate. This is the same test-and-learn cycle that drives performance marketing, adapted for a channel where direct click attribution is not available.
We are also actively running experiments and case studies to strengthen the causal link between GEO interventions and business outcomes. Our goal is to build the most rigorous attribution framework in the GEO space, grounded in the same experimental methodology that peer-reviewed GEO research uses.
We are transparent about the state of GEO attribution: it is early. The measurement infrastructure does not yet exist at the level of maturity that SEO enjoys. But we are actively working to close that gap through structured experiments with real brands.
Our current experiments focus on several questions:
Across 748 GEO recommendations we generated for 62 brands, 87% were on-site fixes that brands can implement today. That gives us a large sample of interventions to track. As brands implement those recommendations and we monitor their SOV over time, we are building the dataset that will make GEO attribution more precise.
We will publish our findings as the data matures. If you want to be part of these case studies, reach out below. We are looking for brands willing to implement GEO recommendations and share anonymized results.
If you are evaluating GEO investment and need an attribution framework, here is where to start:
Attribution does not need to be perfect to be useful. It needs to be rigorous enough to support the decisions it informs.
Start with a baseline. Track your AI Share of Voice daily, see how AI models position your brand, and build the attribution framework your GEO investment needs.
Tell us about your brand and we'll be in touch to walk you through Sill.