What Is LLM Visibility? Definition, Measurement, and 2026 Benchmarks
Read the postDateApr 14, 2026
CategoryResearch

Yesterday we predicted whether a brand would still appear tomorrow. Today we predict where it lands on the ordinal position scale: not_mentioned, mentioned, secondary, or primary. We fit an ordinal regression on 3,115 day-pairs from Sill's daily monitoring of 10 brands across 6 AI platforms (in two variants, with and without momentum features) and pulled platform-level fingerprints from the raw data. The findings here are about what each AI platform appears to be doing, not about which model wins. With 10 brands in our sample, we read the patterns as suggestive rather than conclusive.
TL;DR
Yesterday we predicted whether a brand would still appear tomorrow. Today we predict where: not_mentioned, mentioned, secondary, or primary. We trained an ordinal regression on 3,115 day-pairs from Sill's daily monitoring of 10 brands across 6 AI platforms (two variants, one with momentum features, one without) and pulled platform-level fingerprints from the raw data. The findings are about what each AI platform appears to be doing, not about which model wins. As with any study at this scale, we read the patterns as suggestive rather than conclusive. (1) Each platform appears to build responses differently. Grok and Google AI Overview both list 6+ competitors per response, but in our data Grok recommends a different set of brands every day and parks none of the monitored 10 in the primary slot, while GAIO churns its supporting cast even more aggressively (98% of competitor sets change between days) yet seems to keep its primary brand stable when it picks one. ChatGPT lists fewer brands (5.03 average), gives a single-brand answer 18.5% of the time, and lands at primary tomorrow 11.7% of the time. Perplexity lists only 3.21 brands per response, has zero competitors in 23% of responses, and has the lowest primary rate (6.7%). The pattern suggests it picks few brands and ours rarely make the cut. (2) Position appears sticky. 94% of absent brands stay absent. 71% of primary stays primary. 63% of secondary stays secondary. The mentioned tier looks like the only volatile one: only 24% remain mentioned, with the rest scattering. (3) The features that appear to push position up: very-positive sentiment (+1.60 standardised logit), rolling 7-day SOV (+1.49), Gemini and GAIO platform identity (+1.32, +1.16), shopping cards (+0.68), citations (+0.57). The features that appear to push it down: Grok (−3.60), Copilot (−2.46), brand-level competitor count (−0.84). (4) When we remove rolling 7-day SOV from the features, sov_score reappears (+0.59), platform effects appear to strengthen (Grok goes to −4.26), and very-positive sentiment becomes the dominant predictor (+1.97). Momentum was probably absorbing the other signals. (5) Excerpt length is essentially zero in both variants. Yesterday it was the #1 non-temporal predictor of binary persistence; today it appears to predict presence but not which tier you land in. The mentioned class is too rare in our 10-brand sample (n=42 in train) for any model to learn well; this is the biggest limitation and the first thing that should improve at scale.

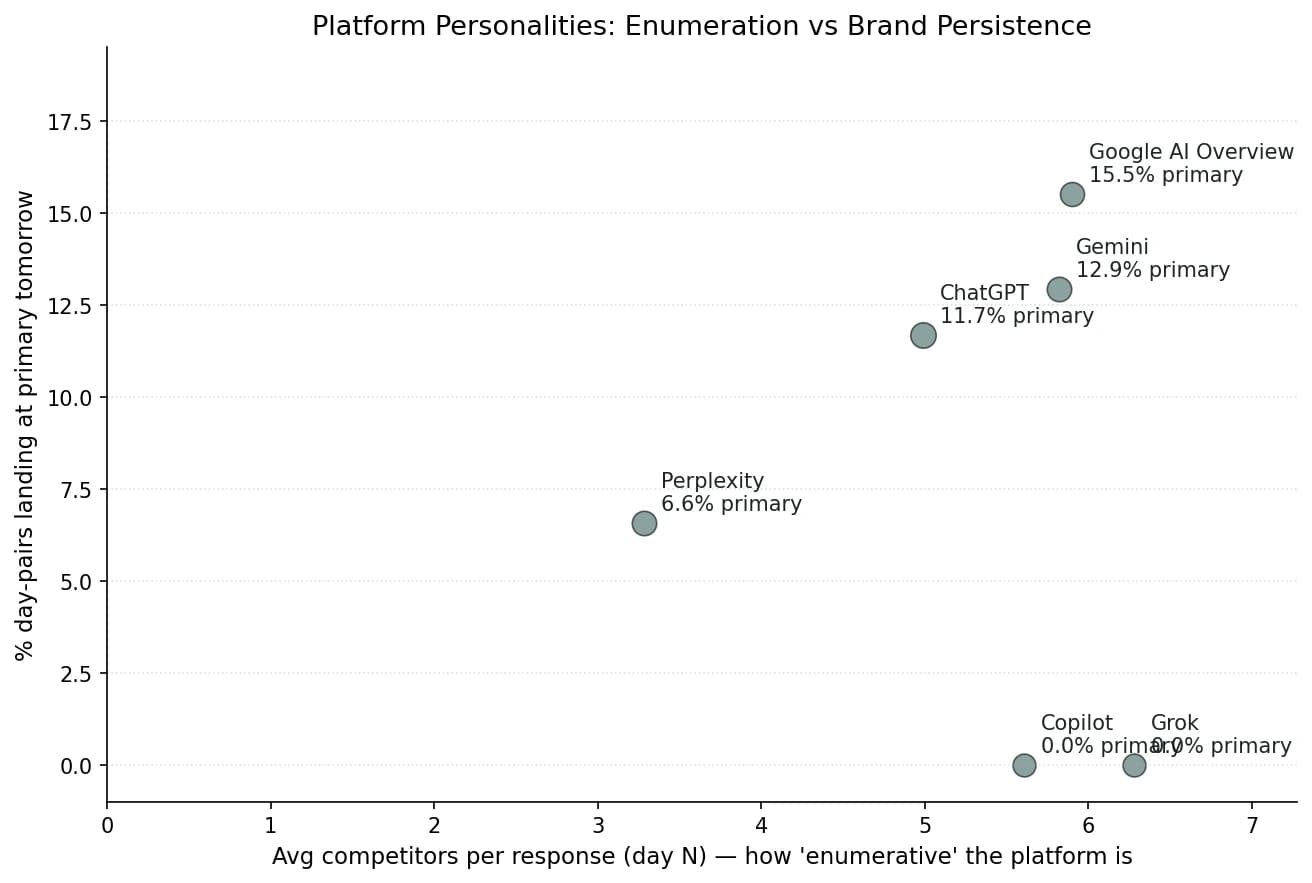
Grok and Google AI Overview both list 6+ brands per response, but in our data Grok cycles through new brands daily and parks none in primary. ChatGPT lists fewer brands (5.03 average) and gives a single-brand answer 18% of the time. Perplexity lists only 3.21 brands per response, the lowest of any platform we measured.
The most surprising finding came from looking at the raw data, not the model. Each AI platform appears to build responses in a structurally different way, and those differences seem to explain most of the position dynamics the model picks up later.
| Platform | Avg comps / response | Avg excerpt (chars) | % primary tomorrow | % absent tomorrow | Set churn day-to-day |
|---|---|---|---|---|---|
| Google AI Overview | 6.10 | 47 | 15.5% | 70.6% | 98.0% |
| Gemini | 5.76 | 28 | 11.8% | 71.2% | 96.2% |
| ChatGPT | 5.03 | 34 | 11.7% | 73.3% | 93.9% |
| Perplexity | 3.21 | 36 | 6.7% | 76.4% | 84.1% |
| Copilot | 5.68 | 2 | 0.2% | 97.4% | 97.2% |
| Grok | 6.15 | 1 | 0.0% | 99.5% | 97.3% |
Google AI Overview lists 6.10 competitors per response on average, with 75.6% of responses containing 5 or more brands and average excerpt length of 47 characters. When monitored brands appear at primary, the data suggests they tend to stay there. 15.5% of GAIO day-pairs land at primary tomorrow, the highest rate of any platform we measured. The supporting cast around the leader appears to be the most volatile in the dataset: 98.0% of competitor sets change between consecutive days. GAIO seems to churn who it lists alongside the leader more aggressively than the other platforms in our sample, while the leader itself stays stable.
Grok lists 6.15 competitors per response, the highest in our data, but the primary slot for our monitored brands is essentially empty: 0.0% of Grok day-pairs land at primary tomorrow, 99.5% land at not_mentioned. The pattern suggests Grok recommends a wide cast of brands; it just rarely picks the same ones as the other platforms in our sample. If a brand is not already on every other AI's recommendation list, Grok looks like the most likely place to first see a competitor surface, though we'd want a larger brand sample to confirm this.
Copilot behaves much like Grok in structure (5.68 competitors per response, 97.4% absent) but with one curious difference: average excerpt length is 2 characters. Copilot lists many brands and writes essentially nothing about any of them. Brand recognition appears to be the loosest of any platform we observed.
Gemini sits in the middle: 5.76 competitors per response, 28-character excerpts, 11.8% primary rate. Of the platforms that actually recommend our brands, Gemini appears to sit between GAIO and ChatGPT on every dimension we measured.
ChatGPT has the lowest competitor count of the active platforms (5.03 average), the highest rate of responses with zero competitors at all (18.5%), and a moderate primary rate (11.7%). ChatGPT looks more likely than the other platforms in our sample to give a single-brand answer, and when it does pick a primary brand it tends to keep it.
Perplexity lists 3.21 competitors per response (the lowest by far), 23.0% of responses contain zero competitors, and only 30.6% contain 5 or more brands. The primary slot also appears to be the hardest to win on Perplexity, at 6.7%, the lowest of the four active platforms. The pattern suggests Perplexity picks few brands and the ones it picks rarely belong to the monitored set.
The user-facing implication is that “AI visibility” appears to mean structurally different things on different platforms. On GAIO and Grok, results suggest the platform's thought process is something like “is your brand in the long list?” On Perplexity, the data points to a more selective process: “is your brand one of the three the platform thinks matter?” On ChatGPT, the pattern looks closer to “is your brand the answer?” The same brand can be visible on one platform and invisible on another for what appear to be entirely structural reasons that have nothing to do with brand quality.
GAIO appears to have the most volatile competitor set (98% changes between days) but the most stable primary slot. Perplexity has the most stable competitor set (16% identical between days) but the lowest primary share. In our data, the leader changes less often than the supporting cast.
Pulling the day-N+1 competitor sets and comparing them against day-N reveals what look like two different kinds of stability that move independently. Perplexity has the most stable set composition in our sample: 15.9% of consecutive day-pairs have an identical competitor set. GAIO has the least stable: only 2.0% identical. ChatGPT sits at 6.1%. Gemini at 3.8%. Copilot and Grok are both around 2.7%.
But primary-tier stability appears to run the other way. GAIO has the highest primary persistence (15.5% of day-pairs) despite churning its supporting cast almost completely. Perplexity has the lowest (6.6%) despite the most stable supporting cast. The pattern suggests that platforms which aggressively shuffle the brands beneath the leader still tend to keep the leader, while platforms that conservatively maintain a small list often do not put our brands in it.
This may be a useful frame for monitoring if it holds at larger scale. Set-level instability seems to tell you about how the model handles the long tail; brand-level instability seems to tell you about how it handles the head. Optimising for one may not automatically optimise for the other.
94% of absent brands stay absent; 71% of primary brands stay primary; 63% of secondary brands stay secondary. The mentioned tier looks like the only volatile one: 24% remain mentioned, the rest scatter.
Before any model gets involved, the position transition matrix appears to tell most of the story. In our data, brands not mentioned on day N have a 94.1% chance of remaining not mentioned on day N+1. Brands in the primary position have a 70.6% chance of staying primary, with most of the remaining mass moving down one slot to secondary (21.2%). Secondary brands stay secondary 63.2% of the time, with 20.7% dropping out entirely and 12.7% getting promoted to primary.
| Day N → Day N+1 | → Not Mentioned | → Mentioned | → Secondary | → Primary | n |
|---|---|---|---|---|---|
| Not Mentioned | 94.1% | 0.5% | 4.3% | 1.1% | 2,208 |
| Mentioned | 31.5% | 24.1% | 35.2% | 9.3% | 54 |
| Secondary | 20.7% | 3.3% | 63.2% | 12.7% | 487 |
| Primary | 6.4% | 1.8% | 21.2% | 70.6% | 326 |
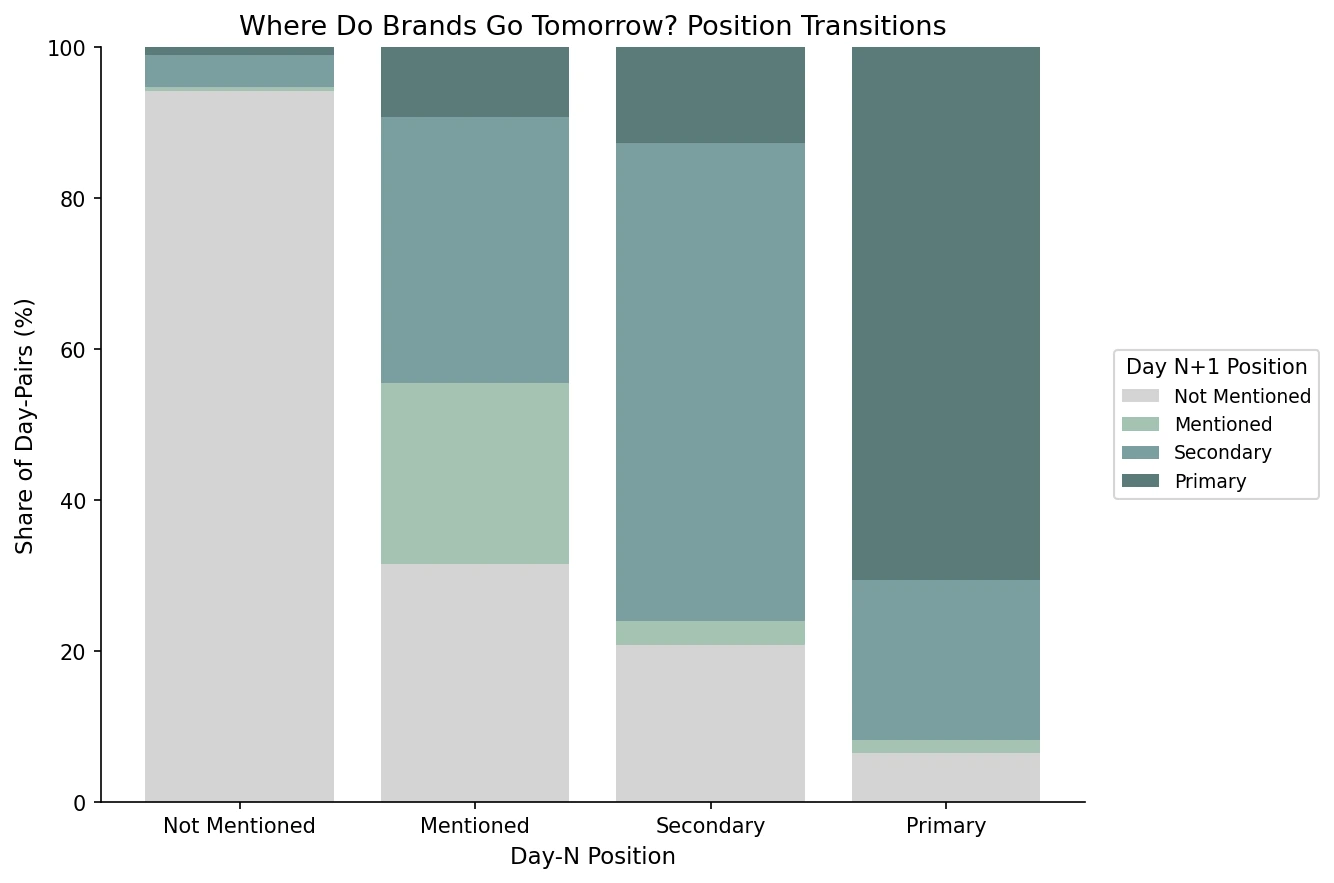
The mentioned tier looks structurally unstable. A brand that gets a passing one-line mention today is roughly equally likely to vanish (32%), be promoted to secondary (35%), or stay in the same passing-mention slot (24%) tomorrow. One reading is that the mentioned class shows up when the AI has not yet decided whether the brand belongs in the answer at all.
Standardised ordinal coefficients with all features: very-positive sentiment +1.60, rolling 7-day SOV +1.49, Gemini and GAIO platform identity +1.32 and +1.16, sov gap to leader +0.99, shopping cards +0.68, citations +0.57. What appears to push it down: Grok −3.60, Copilot −2.46, brand-level competitor count −0.84.
We fit an ordinal regression (mord.LogisticAT, regularised cumulative-link logit) on the upsampled training set. Numerical features were z-scored before fitting so that coefficients are directly comparable across feature types. A coefficient of +X means that a one-standard-deviation increase in the feature shifts the cumulative logit by +X. Positive values appear to push the brand toward higher positions on the not_mentioned → mentioned → secondary → primary scale.
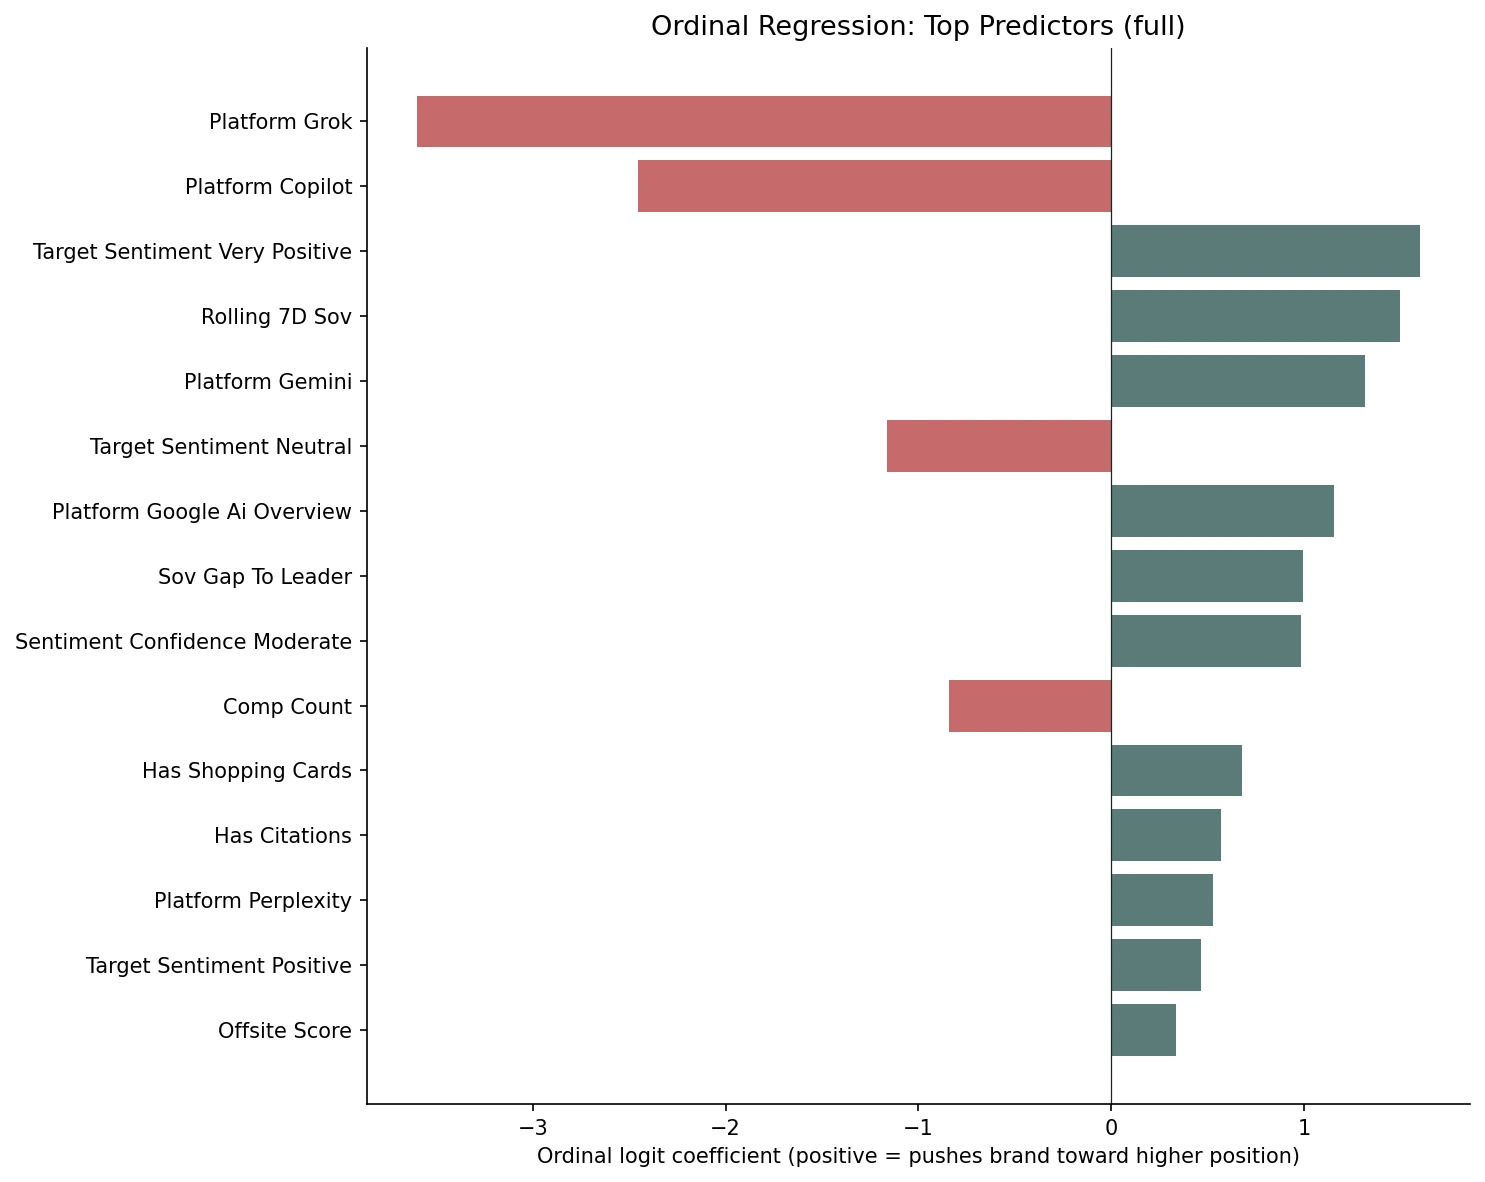
Platform identity appears to dominate the ranking. Grok (−3.60) and Copilot (−2.46) carry the strongest negative coefficients we observed. Gemini (+1.32), Google AI Overview (+1.16), and Perplexity (+0.53) all push toward higher positions relative to ChatGPT (the dropped baseline). The platform a brand is measured on may matter more than any individual response feature.
Sentiment looks like the strongest non-platform predictor. Very-positive sentiment carries +1.60. Positive sentiment carries +0.47. Neutral sentiment carries −1.16, but this last value should probably be read as a proxy for absence. When the brand is not found on day N, sentiment defaults to neutral, so the negative coefficient is likely picking up “the brand wasn't in yesterday's response” rather than “neutral sentiment hurts.”
Rolling 7-day SOV (+1.49) appears to be the strongest temporal predictor. Momentum may compound. Sov gap to leader (+0.99) and the brand-level competitor count (−0.84) follow. Crowded responses appear to shift more between days, which seems to reduce the probability of any single brand holding a high slot.
Shopping cards (+0.68) and citation presence (+0.57) both look meaningful in the model. Both might signal that the AI has structural artefacts pinned to the brand (a product card or a source link), and those artefacts may persist into the next day's response.
When rolling 7-day SOV and streak length are removed: very-positive sentiment +1.97, sentiment confidence moderate +1.21, sov_score reappears at +0.59, platform effects appear to strengthen (Grok −4.26).
Removing the temporal features lets us see what the model picks up when it cannot lean on yesterday's rolling SOV. Three things appear to change.
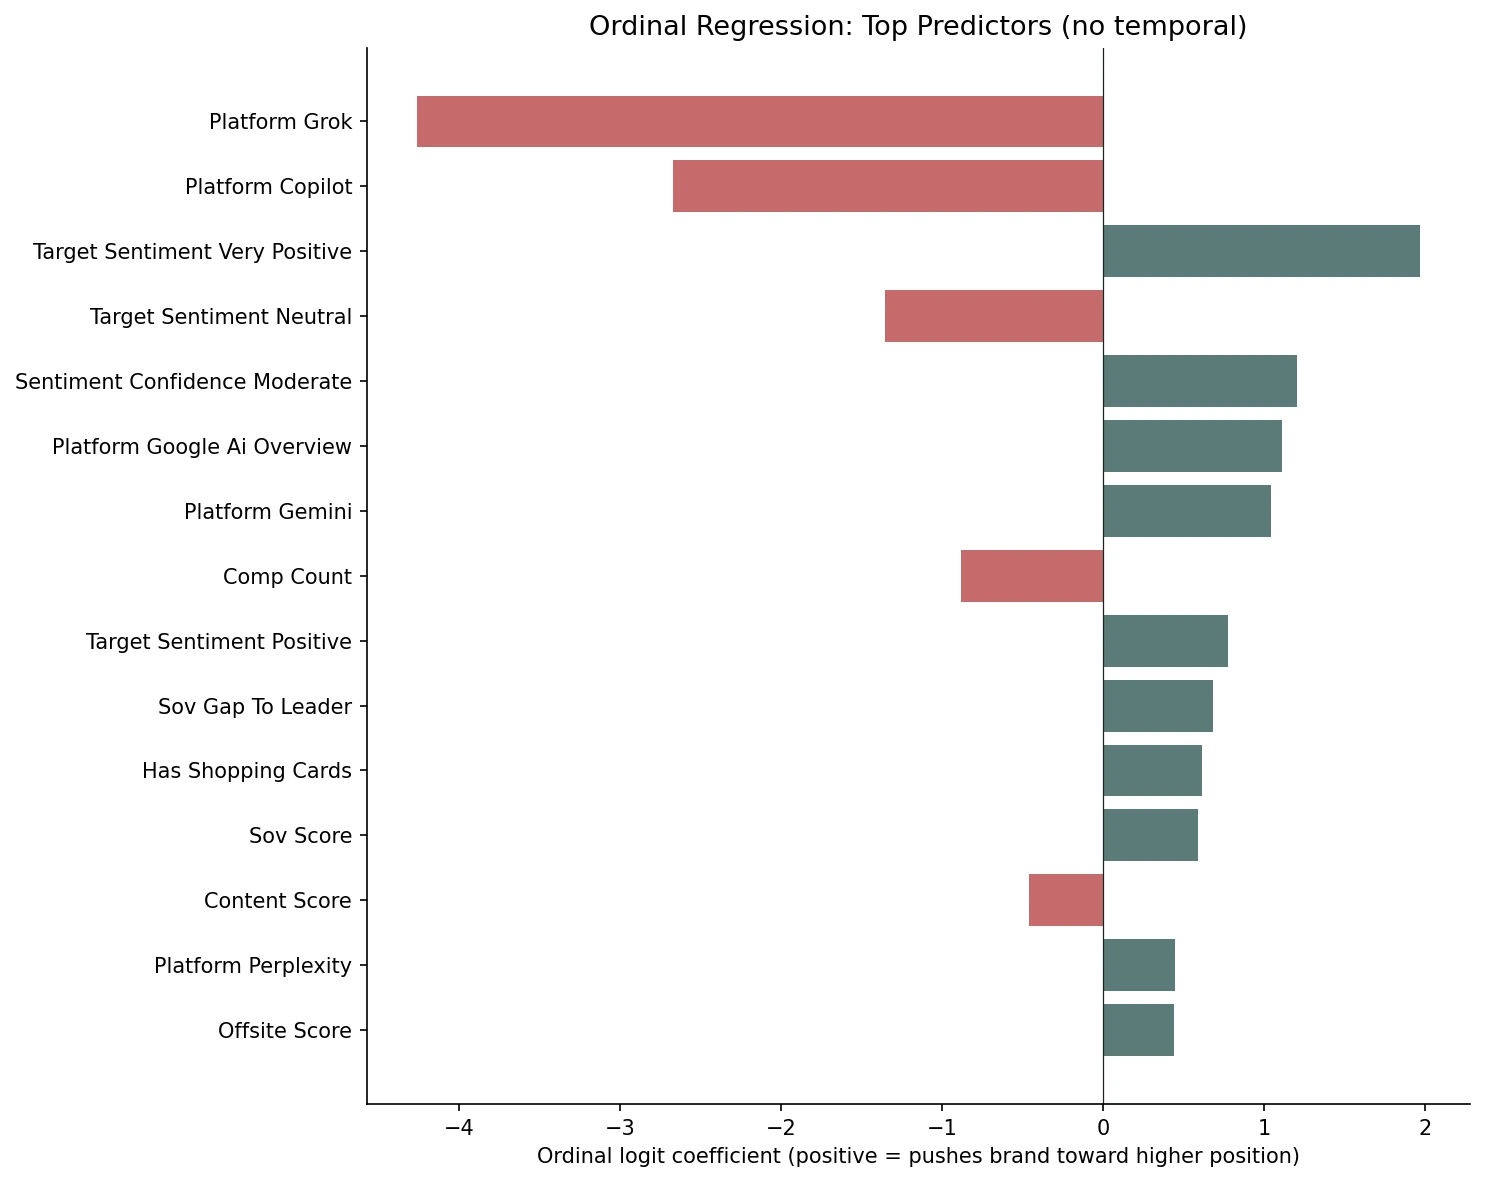
Platform effects appear to strengthen. Grok goes from −3.60 to −4.26. Copilot from −2.46 to −2.67. Without momentum to absorb the variance, the platform identity coefficients seem to swell. The same is true for Gemini and GAIO on the positive side, though the increase is smaller.
Sentiment appears to become the dominant non-platform predictor. Very-positive sentiment goes from +1.60 to +1.97. Positive sentiment from +0.47 to +0.78. Sentiment confidence “moderate” jumps to +1.21 (more on this in the next section). The model now seems to have to express the brand's recent visibility through sentiment rather than through rolling SOV.
sov_score reappears. In the full model, day-N SOV had a coefficient of −0.06, essentially zero. With rolling 7-day SOV removed, sov_score jumps to +0.59. This looks like a collinearity result: the two features appear to encode overlapping information, and L2 regularisation was probably splitting the weight between them. When one is removed, the other seems to absorb the joint effect. The directional reading of both variants appears to be the same. Momentum, sentiment, citations, shopping cards, and platform identity all look like they push position up. The no-temporal variant just reveals which features were probably being absorbed by the rolling SOV signal.
Excerpt length is essentially zero in both variants. Yesterday it was the #1 non-temporal predictor of binary persistence; today it appears to predict presence but not which tier you land in.
Three findings stood out as more interesting in their absence than in any positive coefficient.
Excerpt length appears to have almost no effect. In the full model, the standardised coefficient is +0.007. In the no-temporal model, it is −0.06. Yesterday's persistence study found that excerpt length was the #1 non-temporal predictor of whether a brand appeared at all on day N+1. Today, with the same dataset and the same feature, it appears to predict position essentially not at all. One reading is that excerpt length may predict presence but not relative ranking. A brand can have a long, detailed excerpt and still be at secondary; another can have a short excerpt and still be at primary. The variance within each tier looks wide enough that excerpt length does not separate them.
Sentiment confidence appears non-monotonic. “Moderate” confidence carries +1.21 but “very high” confidence carries only +0.27. The relationship between confidence and position does not look like the linear ladder we might expect. One plausible reading is that when the AI expresses very-high confidence in a sentiment, that sentiment is sometimes hostile, while moderate-confidence sentiment may correspond to a thoughtful, settled positive read. The sample is small enough that this is an early signal rather than a robust finding, but it's worth noting.
Content score is mildly negative (−0.46 in the no-temporal model). Content score is supposed to be a positive signal of brand quality, so seeing a small negative coefficient is counterintuitive. The most likely explanation is collinearity with off-site authority and brand-level features that we cannot fully separate at 10 brands. We are not reporting this as a real negative effect. We are flagging it as a feature pair to watch as the brand sample grows.
With 42 mentioned examples in training, no model has enough signal to learn the class. This is the biggest limitation and the first thing that should improve at scale.
Across both variants and both model types we tried (ordinal regression and a multi-class XGBoost sanity check), the mentioned class looks essentially like noise. The class appears to be too rare in our 10-brand sample for any classifier to find a stable decision boundary. The transition matrix may explain why: the mentioned tier itself looks volatile (24% staying-rate) so even with more samples the signal-to-noise ratio appears to be the worst of the four classes. This should improve the most at scale; as Sill's monitoring base grows past 50 brands, the mentioned class should accumulate enough examples to model directly.
Yesterday: will the brand appear tomorrow (binary). Today: where will it land (ordinal). The two studies appear to share an answer but disagree on which features matter most.
Yesterday's persistence study found rolling 7-day SOV, position, citation count, and competitor count appeared to predict whether a brand appears on day N+1. Today's position study finds the same features appear to predict where the brand lands, with platform identity dominating once day-N target_position is excluded from the features.
The biggest disagreement between the two studies is excerpt length. Yesterday it was the #1 non-temporal predictor of presence; today it is essentially zero. The disagreement may be the finding: excerpt length seems to predict presence, not tier. Whether the AI talks about your brand at all may be a different question from where it ranks the brand among alternatives, and the features that answer those two questions do not appear to be the same. For brands optimising AI visibility, one reading of these results is that platform choice and steady momentum may matter more than any single-day intervention. The structural shape of each platform (how many brands it lists, how much it writes about them, how often it shuffles the supporting cast) appears to determine what “visibility” even means on that platform. And being mentioned looks like a transient state worth either reinforcing into a real recommendation or accepting as noise. As always with a 10-brand sample, these are directional signals rather than firm conclusions.
Sill monitors ChatGPT, Gemini, Perplexity, Google AI Overviews, Copilot, and Grok daily through their actual chat interfaces, tracking position, sentiment, citations, and shopping cards.
mord.LogisticAT. github.com/fabianp/mordTell us about your brand and we'll be in touch to walk you through Sill.