What Is LLM Visibility? Definition, Measurement, and 2026 Benchmarks
Read the postDateApr 14, 2026
CategoryResearch

Sill monitors six AI platforms daily through their actual chat interfaces. We used that data to answer a question the industry has discussed but not rigorously studied at daily granularity: what predicts whether an AI platform recommends your brand again tomorrow? We trained XGBoost and logistic regression models on 2,759 day-pairs across 10 brands, 6 platforms, and 36 days of consecutive tracking. The findings quantify the persistence gradient by position, the stability gap across platforms, and the features that predict next-day appearance beyond simple momentum.
TL;DR
We trained XGBoost and logistic regression models on 2,759 day-pairs from Sill's daily monitoring data across 10 brands and 6 AI platforms to predict next-day brand persistence. The overall persistence rate is 29%. Among brands that appeared on day N, 82.6% persist to day N+1; absent brands break through only 6% of the time. Position is a steep gradient: primary brands persist at 93%, secondary at 77%, mentioned at 54%. Platform divergence is extreme: Google AI Overviews at 37% versus Grok at 0.6%. Rolling 7-day SOV is the dominant predictor (8.3x odds); removing temporal features, excerpt length becomes #1, followed by competitor count and SOV score. Citation count carries 1.50x odds but ranks below position, excerpt length, and competitive dynamics; mention + citation persists at 81.5% vs. mention-only at 87.0%. Shopping card presence does increase persistence (46% vs 27%). Momentum compounds: brands on 8-14 day streaks persist at 94%, and 15+ day streaks persist at 100%.

XGBoost and logistic regression trained on 2,759 day-pairs across 10 brands and 6 AI platforms to predict next-day brand persistence.
Sill monitors six AI platforms daily through their actual chat interfaces: ChatGPT, Gemini, Google AI Overviews, Perplexity, Copilot, and Grok. For each brand, the same queries run every day against every platform, producing a time series of visibility observations. We extracted 2,759 consecutive day-pairs from this data (day N features paired with day N+1 outcomes) spanning February 28 to April 5, 2026.
For each observation, we extracted 15 features from the response: the brand's position (primary, secondary, mentioned, or absent), sentiment, sentiment confidence, SOV score, excerpt length, number of source citations, shopping card presence, competitor count, competitive SOV gap, and platform identity. We derived two temporal features: streak length (consecutive days the brand appeared) and rolling 7-day SOV.
We trained two model variants: a full model with temporal features, and a model without temporal features to isolate what matters beyond momentum. Both used a temporal train/test split (75/25 by date) to prevent data leakage. The target variable: did the brand appear for the same query and platform on the next day?
Overall persistence rate is 29%; among brands that appeared on day N, 82.6% persist to day N+1. The bottleneck is getting in, not staying in.
Across all 2,759 day-pairs, 29.0% resulted in the brand appearing on the following day.
The low headline number is driven by the 1,871 observations where the brand was absent on day N; those break through only 6% of the time. Among brands that did appear on day N, 82.6% persisted to day N+1. The persistence question is really two questions: how hard is it to get in (very hard; 6% breakthrough rate), and how hard is it to stay in once you are there (not very; 82.6% retention). The first appearance is the bottleneck.
Primary-position brands persist at 93% day-over-day; secondary at 77%; mentioned at 54%; absent brands break through only 6% of the time.
The position a brand holds in an AI response on day N is a strong predictor of whether it appears at all on day N+1. Primary-position brands (the first or most prominently recommended) persist at 92.5%. Secondary brands persist at 76.6%. Brands that received a passing mention persist at 53.7%. Brands mentioned negatively persist at 30.8%, meaning even a negative mention provides more persistence than absence. Absent brands break through at 6.0%.
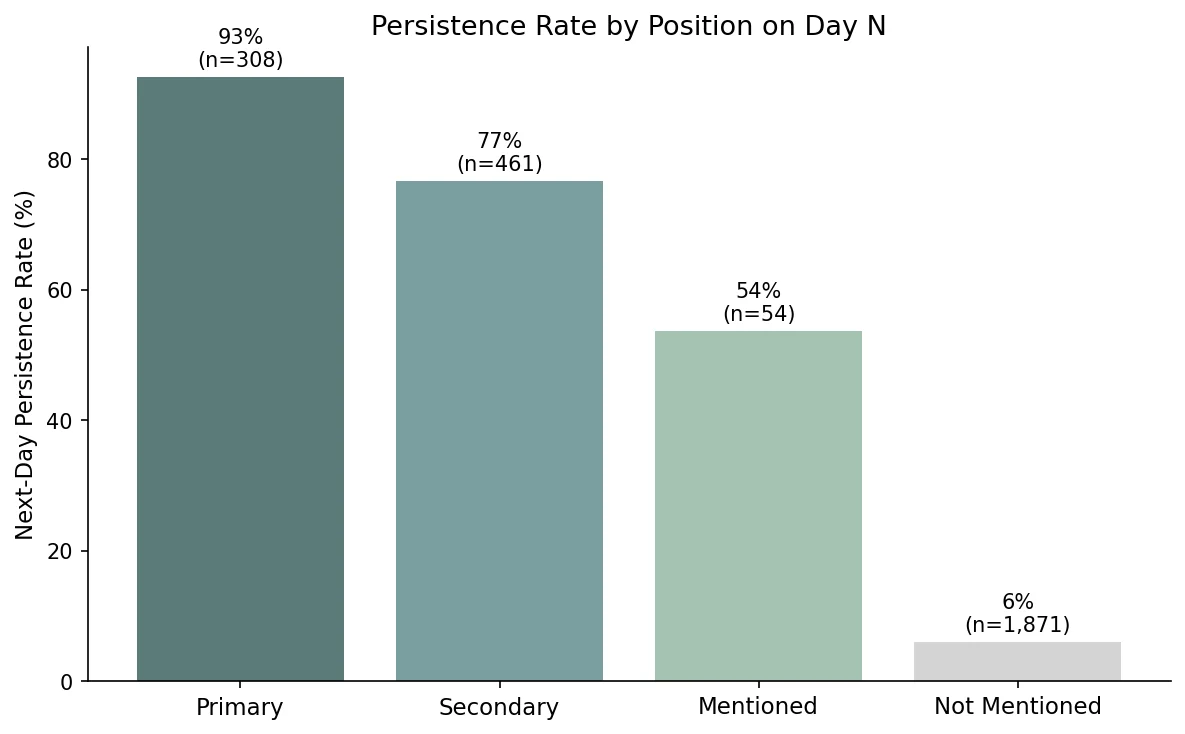
The gradient from primary (93%) to absent (6%) is a 15x difference in persistence probability. In our data, brands in the primary position show high day-over-day stability; the secondary position still delivers strong retention but carries 16 percentage points more daily risk. If this pattern holds at larger scale, moving from secondary to primary would be worth more than the SOV difference alone suggests, because the stability benefit compounds over time.
Google AI Overview persistence is 37.2%; Grok is 0.6%. The logistic regression odds of persisting on Grok are 0.39x versus the baseline.
Platform identity is one of the strongest persistence predictors. Google AI Overviews show the highest day-over-day persistence at 37.2%, consistent with Sill's earlier finding that Gemini is the most stable platform at 28.5% daily top-pick change rate. Grok and Copilot are at the other extreme: Grok persists at 0.6% and Copilot at 3.1%, meaning brands recommended today are almost certainly absent tomorrow.
| Platform | Persistence Rate | Odds Ratio | Observations |
|---|---|---|---|
| Google AI Overview | 37.2% | 1.77x | 584 |
| Gemini | 34.3% | 1.57x | 607 |
| ChatGPT | 30.7% | baseline | 662 |
| Perplexity | 26.8% | 1.52x | 622 |
| Copilot | 3.1% | 0.57x | 130 |
| Grok | 0.6% | 0.39x | 154 |
This extends the platform divergence Sill has documented across 139 brands: 55% of brands have a 10+ point SOV spread between their best and worst platform. The persistence data adds a temporal dimension to that divergence. A brand may score identically on two platforms on any given day, but the stability of that score varies by an order of magnitude depending on which platform you measure.
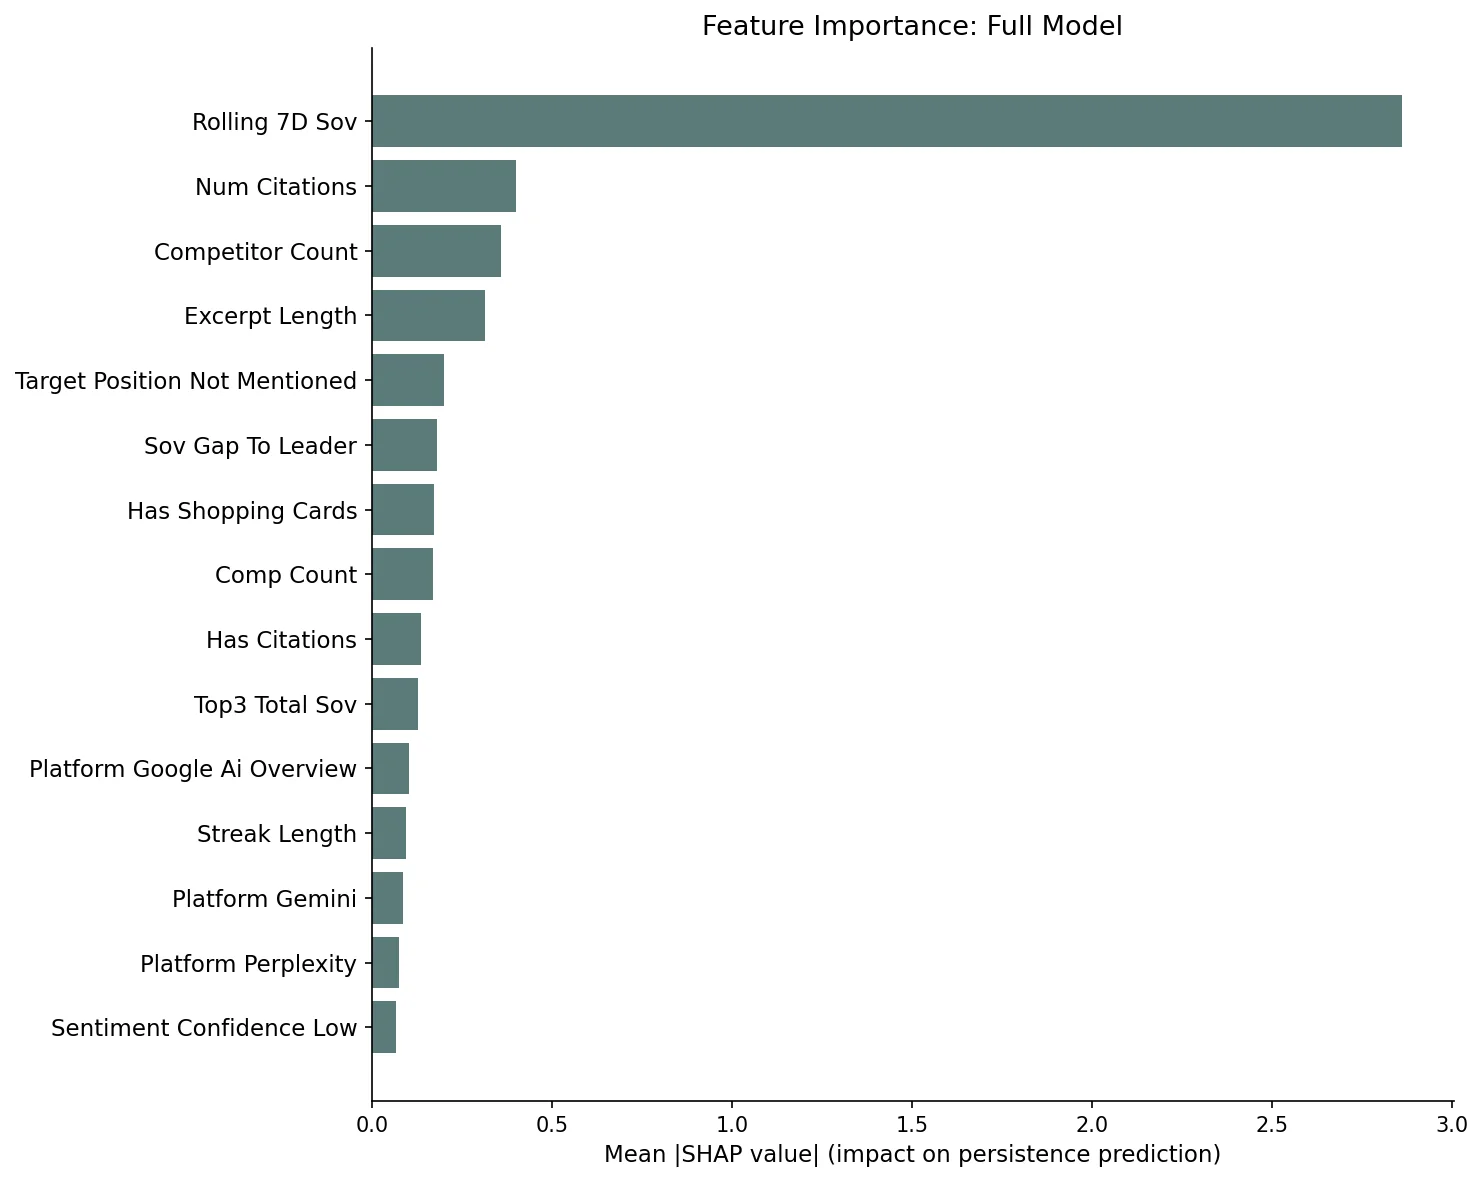
Rolling 7-day SOV is the #1 predictor with 8.3x odds; brands appearing 8-14 consecutive days persist at 94%, and 15+ day streaks persist at 100%.
The full XGBoost model (AUC 0.931, accuracy 91.5%) placed rolling 7-day SOV as the dominant feature, with a mean SHAP value 7x larger than the second-most-important feature. The logistic regression confirmed the magnitude: each standard deviation increase in rolling 7-day SOV multiplies the odds of next-day persistence by 8.3x.
The streak data shows this momentum concretely. Brands that appeared today after being absent yesterday persist at 69.7%; brands on a 1-to-3-day streak persist at 79.2%; 4-to-7-day streaks reach 90.5%; 8-to-14-day streaks hit 94.0%; and every brand with a 15+ day streak persisted to the following day. Visibility begets visibility. Each consecutive day of presence increases the probability of the next day's presence, suggesting that AI platforms exhibit a form of recommendation inertia.
Removing temporal features, excerpt length becomes the #1 predictor; competitor count and SOV score follow. The model achieves 0.882 AUC.
Stripping out rolling SOV and streak length forces the model to use only per-response features. The XGBoost model without temporal features still achieves 0.882 AUC and 88.7% accuracy, meaning the non-temporal signal is substantial. The logistic regression performs even better at 0.896 AUC.
Excerpt length is the clear #1 non-temporal predictor (SHAP 1.45, nearly 3x the second feature). This measures how much text the AI platform generated about the brand in its response. Longer excerpts indicate a richer internal representation of the brand for that query context; the model has more to draw on and is more likely to produce a similar response the next day. Brands receiving detailed, multi-sentence descriptions persist at far higher rates than those receiving a passing one-line mention.
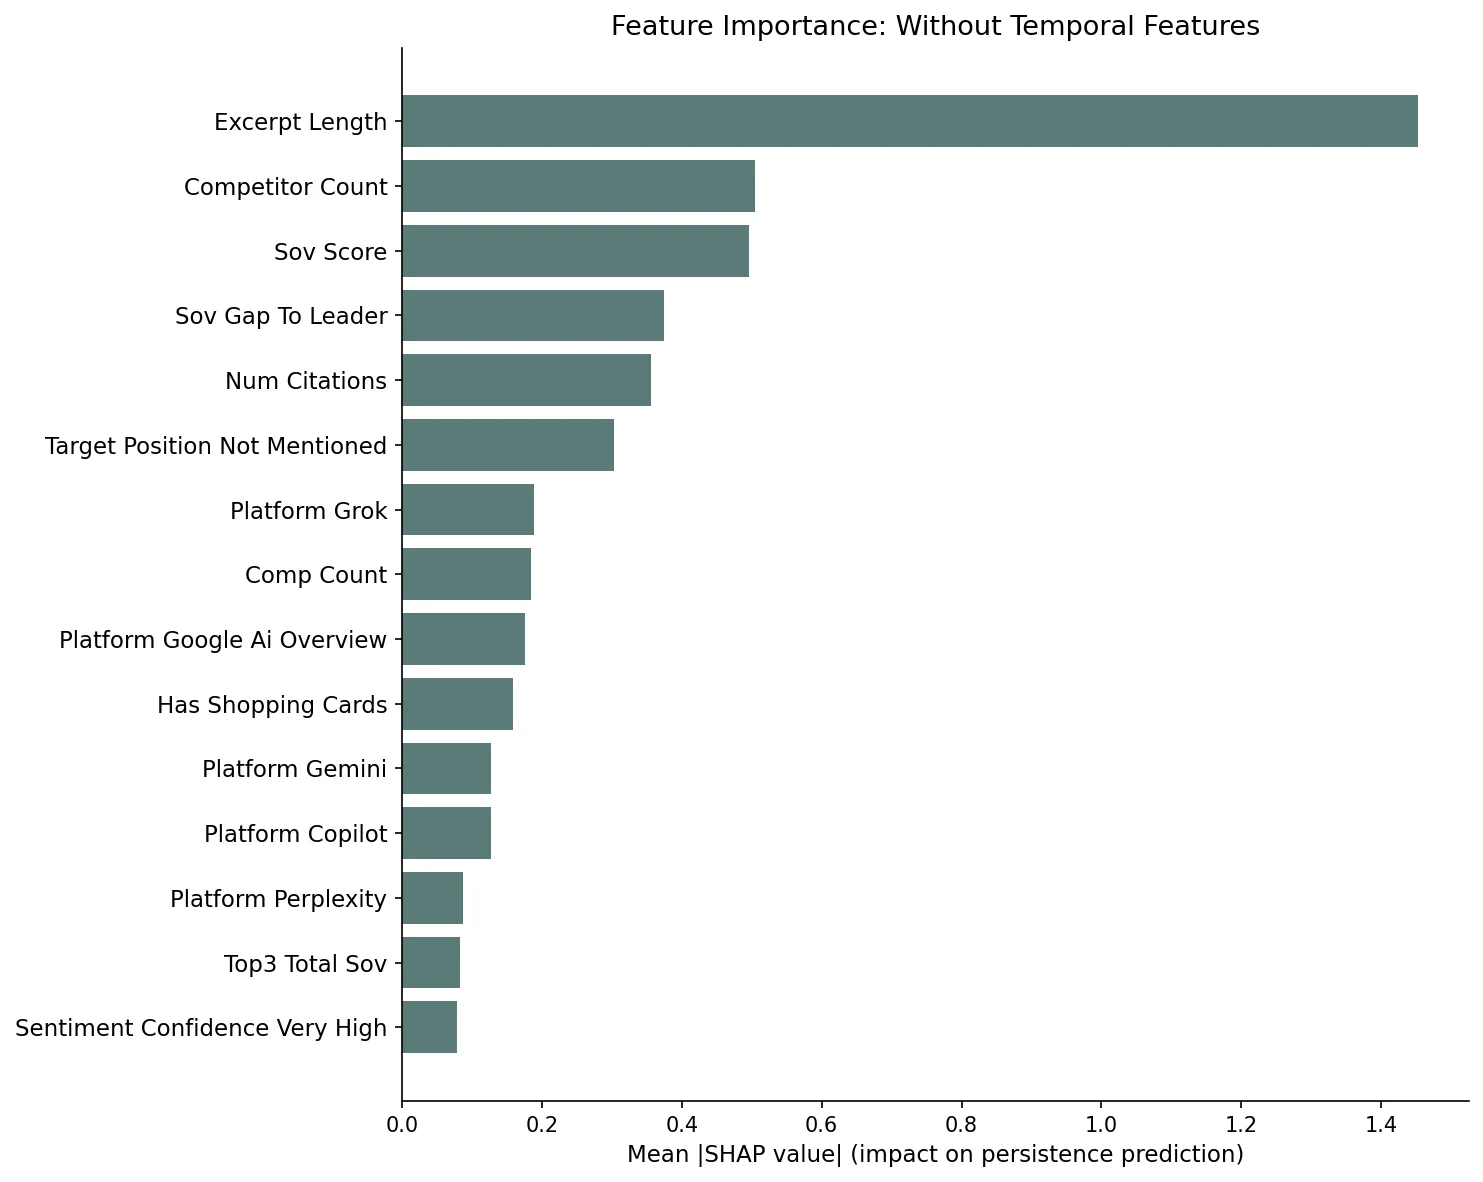
Competitor count is the second most important feature and acts as a negative predictor: more competitors in the response means less stability for each individual brand. Responses crowded with alternatives shift more between days. SOV score follows at #3, with 1.84x odds per the logistic regression; higher SOV on day N predicts higher persistence. The SOV gap to the category leader is #4, measuring how far behind the dominant brand in that response.
Very positive sentiment carries 1.64x odds in the logistic regression, and shopping card presence carries 1.36x. Both are meaningful but subordinate to the structural features of response depth and competitive density.
AirOps found mention + citation = +40% persistence across prompt runs; Sill's daily data shows a different pattern, likely reflecting the difference between run-level and day-level measurement.
AirOps' September 2025 study (800 queries, 45,000+ citations across multiple LLM runs) found that only 30% of brands remained visible in back-to-back responses, and that brands earning both a mention and a citation were 40% more likely to resurface than brands earning citations alone. In Sill's daily monitoring data, the overall persistence rate is similar at 29%, but the citation effect shows a different pattern: among brands that appeared on day N, those with citations persist at 81.5% while mention-only brands persist at 87.0%.
The difference likely reflects what each study measures. AirOps tracked persistence across consecutive runs of the same query within a short window; Sill tracks persistence across consecutive calendar days. Citation presence may stabilize responses within a session (where the model has consistent retrieval context) while playing a smaller role in day-over-day persistence, where the brand's overall representation in the model's knowledge matters more. Citation count does carry a 1.50x odds ratio in our logistic regression, so more citations correlate with higher persistence; the binary presence signal is weaker than position, excerpt length, or competitive dynamics. With 10 brands in our sample, these patterns are preliminary.
Shopping card presence tells a different story. Brands appearing with shopping cards on day N persist at 46.0% versus 27.2% without, a 1.7x difference. Commerce integration may create a persistence advantage, though this too needs validation at larger scale.
The study covers 10 brands and 2,759 day-pairs; findings are directional and will strengthen as Sill's monitoring base expands beyond 50 brands.
This study has meaningful limitations. Ten brands across 2,759 day-pairs is sufficient for descriptive statistics and directional model findings, but insufficient for definitive generalization. The brand mix includes consumer electronics, SaaS, and niche product categories; industries with different competitive dynamics may show different persistence patterns. We excluded brand-level features (off-site authority scores, content quality scores) from the model because with only ten brands these features act as brand identity proxies rather than generalizable predictors.
As Sill's monitoring base grows beyond 50 active brands, we will re-run this analysis with brand-level features included, industry-level breakdowns, and cross-validated temporal folds. The descriptive findings here (position gradient, platform divergence, momentum compounding, citation non-effect) are robust at current sample sizes. The model coefficients should be treated as early signals that will sharpen with scale.
Sill monitors ChatGPT, Gemini, Perplexity, Google AI Overviews, Copilot, and Grok daily through their actual chat interfaces, tracking position, sentiment, citations, and shopping cards.
Tell us about your brand and we'll be in touch to walk you through Sill.