What Is LLM Visibility? Definition, Measurement, and 2026 Benchmarks
Read the postDateApr 14, 2026
CategoryResearch

When someone asks ChatGPT for a recommendation in your category, does your brand show up? AI Share of Voice measures exactly that. And for most brands, the answer is not good. Here's what the data shows, why it matters, and what you can do about it.
TL;DR
AI Share of Voice measures how often AI platforms recommend your brand. Across 77 brands we analyzed, the median score was 3.8 out of 100. Traditional SEO metrics don't predict AI visibility — off-site mentions and statistical content density do.
For two decades, SEO was the discipline that determined whether your brand got found online. You optimized for keywords, built backlinks, and tracked your position on Google's results page. That world is shrinking.
According to G2's 2025 Buyer Behavior Report, GenAI chatbots are now the #1 source influencing B2B vendor shortlists, ahead of software review sites. In a survey of 1,169 decision-makers, 29% said they start vendor research via LLMs more frequently than Google. A Responsive study found that among tech buyers specifically, 80% now use GenAI as much as or more than search engines for vendor research.
Meanwhile, traditional search itself is being eaten alive. An Ahrefs study of 300,000 keywords found that Google AI Overviews correlate with a 58% lower click-through rate for the top-ranking page. The organic traffic brands used to count on is eroding, and where it goes matters more than ever.
So the question for every brand becomes: when a buyer asks an AI assistant for a recommendation in your category, do you show up? And if you do, how does the AI frame you? That's what AI Share of Voice measures.
In traditional marketing, Share of Voice (SOV) has long been used to measure a brand's advertising presence relative to competitors. The concept was introduced in the context of advertising spend and media coverage, and research by Jones (1990) and later Binet & Field (2007) established a well-documented relationship between SOV and market share: brands that maintain an SOV above their market share tend to grow, while those below tend to shrink.
AI Share of Voice applies the same principle to a new channel. Instead of measuring advertising impressions or media mentions, it measures how often AI platforms recommend your brand when users ask purchase-intent questions. It answers a simple question: when someone asks ChatGPT, Perplexity, Gemini, or Google AI Overviews about your category, what percentage of the time does your brand appear in the response, and in what position?
The Harvard Business Review introduced the concept of "Share of Model" in June 2025, describing how LLMs build internal representations of brands and how those representations influence recommendations. Their finding: 58% of consumers now turn to GenAI tools for product recommendations, up from 25% in 2023.
AI SOV isn't a vanity metric. It is a leading indicator of where buyer attention is heading. As more purchase research moves to AI assistants, the brands that show up in those responses will capture demand. The ones that don't will lose it to competitors they may not even be tracking yet.
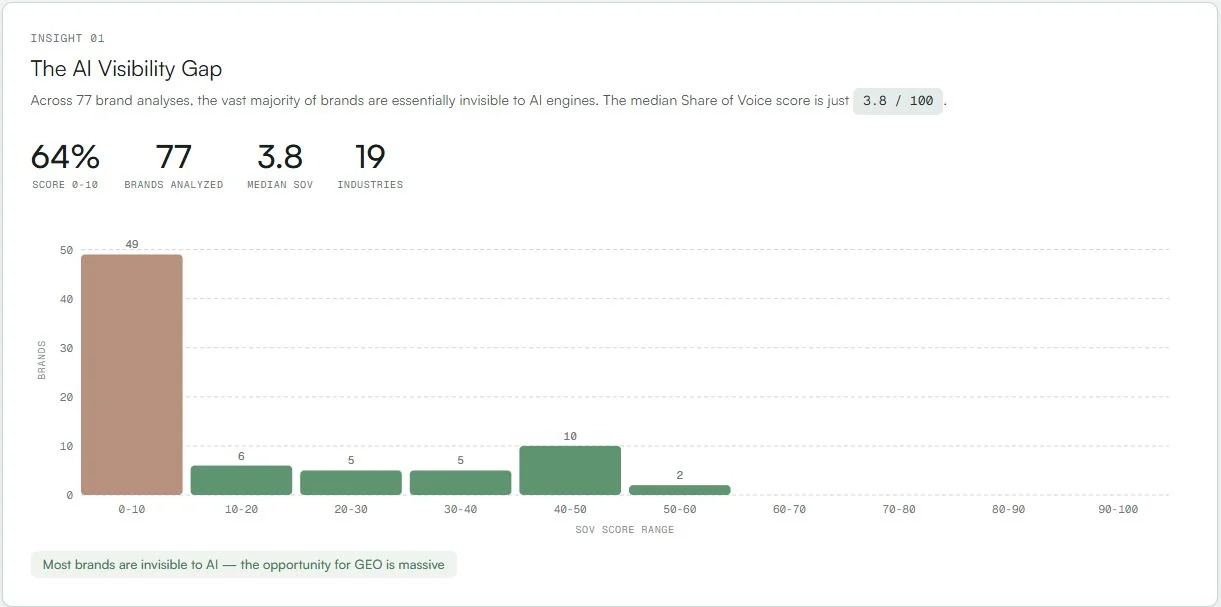
We analyzed 77 brands across 19 industries. The results were stark. The median Share of Voice score was just 3.8 out of 100. Nearly two-thirds of brands (64%) scored between 0 and 10, meaning they barely register in AI responses at all.
This isn't a problem limited to small or unknown companies. Established brands with strong traditional SEO presence, active social media, and significant ad budgets were landing in the single digits. The rules that worked for Google search don't carry over to AI recommendations.
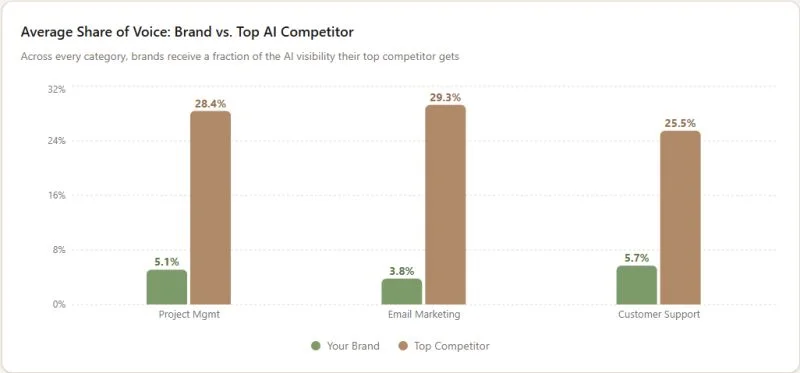
Even among brands that do show up in AI responses, the gap between them and the top-ranked competitor in their category is significant. Across project management, email marketing, and customer support, we consistently see the same pattern: brands average 4-6% SOV while their top AI competitor sits at 25-29%.
That gap is not something you can close with a better blog post or a keyword optimization pass. It reflects a fundamental difference in how AI engines perceive and weight brands. The top competitor isn't necessarily the market leader by revenue or headcount. It's the brand that AI models have the strongest association with for a given set of queries.
This matches what an Ahrefs study of 75,000 brands found: the single strongest predictor of whether an LLM recommends your brand is how often you're mentioned across the web, with a correlation coefficient of 0.664. Domain Authority, the backbone of traditional SEO, showed a correlation of just 0.218.
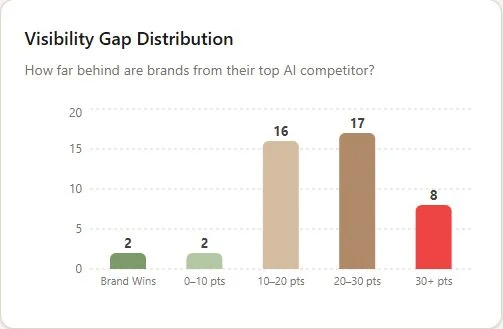
We measured the point gap between each brand and their category's top AI competitor. The distribution tells a clear story. Out of 45 brand-category pairs analyzed, only 2 brands were actually winning their category in AI visibility. Another 2 were within 10 points of the leader. But the majority (33 out of 45) were trailing by 10 to 30+ points.
Eight brands were behind by 30 or more points. At that level, the top competitor appears in AI responses consistently while the brand in question barely shows up. That is the difference between being part of the conversation and being left out entirely.
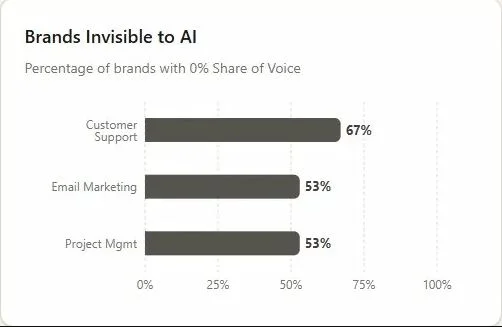
The "Brands Invisible to AI" chart drives the point home. In customer support, 67% of brands analyzed had 0% Share of Voice. In email marketing and project management, it was 53%. These aren't niche categories. These are competitive, well-funded markets where brands spend millions on traditional marketing. Yet more than half of them don't exist in AI search results at all.
The foundational Generative Engine Optimization paper by Aggarwal et al. (KDD 2024, Princeton/Georgia Tech/IIT Delhi) tested nine optimization methods across 10,000 queries. Their findings overturned some common assumptions. Keyword stuffing, the bread and butter of old-school SEO, performed 10% worse than baseline. What actually moved the needle was adding statistics to content (30-40% visibility improvement) and including source citations.
A companion study from UC Berkeley by Wan et al. (ACL 2024) explored this further. They found that LLMs largely ignore stylistic authority signals that humans find persuasive, like scientific references or appeals to authority. Instead, they rely on textual relevance and factual density. The content that ranks in AI isn't the flashiest. It's the most substantive.
But on-site content optimization is only half the picture. Our data consistently shows that off-site presence is the stronger lever.
One of the most persistent misconceptions in this space is that if you rank well on Google, you'll rank well in AI responses too. The data says otherwise.
A SearchAtlas study of 21,767 domains found correlations between domain authority metrics and LLM visibility of r = -0.12 for ChatGPT, -0.18 for Perplexity, and -0.09 for Gemini. The relationship isn't just weak. It's slightly negative. High Domain Authority doesn't help, and in some cases it may actually be associated with lower AI visibility.
This shouldn't be surprising when you consider how differently these systems work. Google ranks pages based on link graphs, crawl data, and keyword matching. LLMs synthesize answers from training data and grounded web retrieval. They don't see your backlink profile. They don't care about your meta tags. They care about whether the information they find about your brand is substantive, consistent, and widely corroborated across trusted sources.
Research from CMU's AutoGEO paper (Wu et al., 2025) made this explicit: engine-specific optimization rules consistently outperform generic strategies. What works for ChatGPT may not work for Perplexity, and what works for Google search barely matters for either. The researchers achieved a 35.99% average visibility improvement using engine-specific tactics, compared to marginal gains from applying traditional SEO practices.
The foundational GEO paper (Aggarwal et al., KDD 2024) put it even more bluntly: keyword stuffing, the most basic SEO tactic, performed 10% worse than doing nothing. Meanwhile, adding statistics to content improved AI visibility by 30-40%, and including source citations showed similar gains. GEO is a fundamentally different discipline that requires its own measurement, its own strategies, and its own tools.
There's a subtlety in AI visibility measurement that most platforms get wrong, and it matters a lot.
Most GEO and AI monitoring tools query AI platforms through their developer APIs. When they ask ChatGPT a question, they're calling the OpenAI API. When they query Gemini, they're using the Google AI API. This is the obvious technical choice. It's fast, it's programmable, and it scales easily.
The problem is that the API experience and the chat experience are fundamentally different products. When a real buyer opens ChatGPT and asks "What's the best CRM for a 50-person team?", ChatGPT activates web search, pulls in live sources, shows citation pills with linked references, and sometimes surfaces shopping cards or map results. The OpenAI API, by default, does none of this. It returns a completion from the model's training data without web grounding, without citations, and without the retrieval-augmented generation (RAG) pipeline that the chat product uses.
The gap is significant. A University of Toronto study (Chen et al., 2025) analyzing AI search engines found that these platforms deliver 69-82% earned media citations, meaning most of what they recommend comes from web-grounded retrieval, not parametric memory alone. If you're measuring AI visibility through an API that skips the web retrieval step, you're measuring a different thing entirely. You're measuring what the model "knows" from training, not what it actually tells users.
The Yext study of 6.8 million citations demonstrated just how different each platform's citation behavior is when using the actual chat products: Gemini draws 52% of citations from brand-owned websites, ChatGPT pulls 49% from third-party sites, and Perplexity leans on specialized directories. These citation patterns only exist in the web-grounded chat experience, not in raw API completions.
At Sill, we measure what real buyers actually see. Instead of calling model APIs, we query the actual chat interfaces of ChatGPT, Perplexity, Gemini, Google AI Overviews, Copilot, and Grok, with web search enabled, citations included, and geographic context applied. This means the SOV scores, citations, and competitive rankings you see in a Sill report reflect the real experience your potential customers have when they ask an AI for a recommendation. Not a simulation of it. Not an approximation. The actual thing.
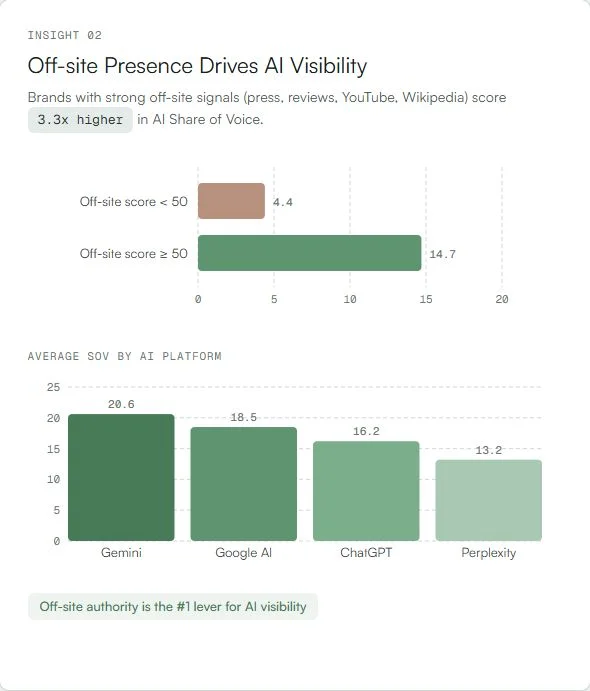
Across our 77-brand analysis, brands with strong off-site signals (press coverage, review site listings, YouTube presence, Wikipedia pages) scored 3.3x higher in AI Share of Voice than brands without them. The average SOV for brands with an off-site score above 50 was 14.7, compared to just 4.4 for those below 50.
This aligns with research from the University of Toronto by Chen et al. (2025), who found that AI search engines deliver 69-82% earned media citations, compared to Google's 40-45%. In other words, AI platforms weight what others say about you far more heavily than what you say about yourself.
The breakdown by platform is also telling. In our data, Gemini delivered the highest average SOV at 20.6, followed by Google AI at 18.5, ChatGPT at 16.2, and Perplexity at 13.2. Each platform uses different source signals, which is why brands can't rely on a single optimization strategy.
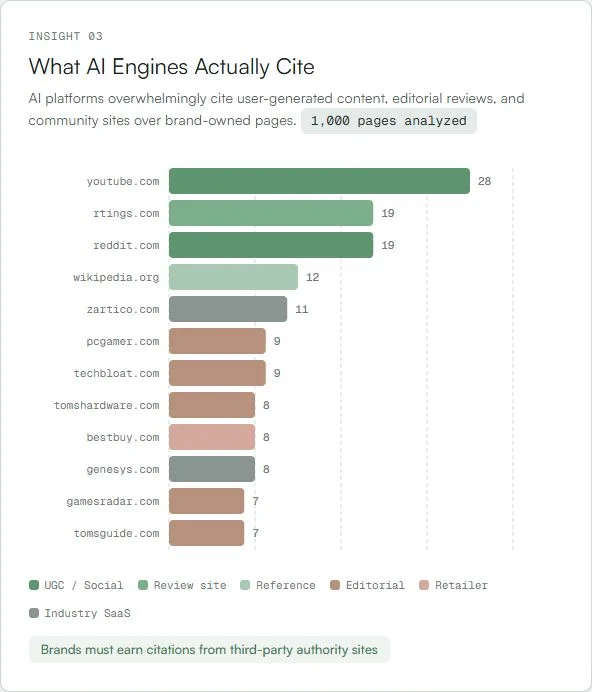
We analyzed 1,000 pages cited in AI responses to understand where the recommendations are actually coming from. The results are clear: AI platforms overwhelmingly cite user-generated content, editorial reviews, and community sites over brand-owned pages.
YouTube leads with 28 citations, followed by review sites like rtings.com (19), Reddit (19), and Wikipedia (12). After that comes a mix of editorial outlets, specialist review sites, and retailers. What's notably absent from the top of this list? Brand websites themselves.
This matches findings from a Yext analysis of 6.8 million citations across 1.6 million AI responses. They found striking differences by platform: Gemini pulls 52% of citations from brand-owned websites, while ChatGPT draws 49% from third-party sites like Yelp and TripAdvisor. Perplexity leans into specialized directories and niche sources.
The takeaway: if your brand isn't represented on the platforms that AI engines actually trust and cite, your own website alone won't carry you. You need a presence on YouTube, Reddit, review sites, and Wikipedia. You need press coverage. You need third-party validation.
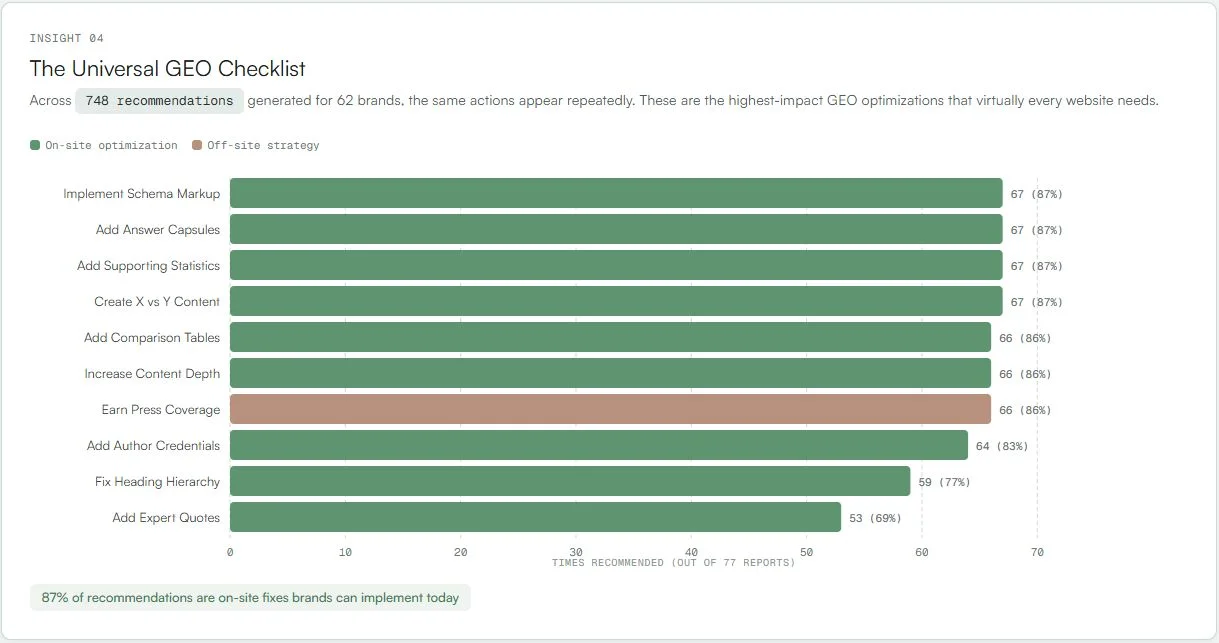
Across 748 recommendations generated for 62 brands, the same actions appear repeatedly. These are the highest-impact Generative Engine Optimization tactics that virtually every website needs. The good news: 87% of them are on-site fixes that brands can implement today without waiting for press coverage or third-party reviews.
The top recommendations, each appearing in 87% of reports, are implementing schema markup, adding answer capsules (concise summary paragraphs that AI can directly extract), adding supporting statistics, and creating X vs. Y comparison content. Close behind at 86% are comparison tables, increasing content depth, and earning press coverage.
These findings are grounded in peer-reviewed research. The foundational GEO paper (Aggarwal et al., KDD 2024) demonstrated that adding statistics and citations improved visibility by 30-40%. Research from Wu et al. at CMU (2025) introduced AutoGEO, an automated optimization framework that achieved a 35.99% average improvement in AI visibility. Their key finding: engine-specific optimization rules consistently outperform generic strategies.
An SE Ranking study of 2.3 million pages adds another dimension: freshness. Pages updated within 2 months earn 5.0 AI citations on average, compared to 3.9 for older pages. AI engines favor current content, which means this isn't a one-time optimization. It requires ongoing attention.
There is no Search Console for LLMs. No impression data. No click-through rates from AI answers. LLM outputs are non-deterministic, meaning the same query can produce different results each time. Research from Superlines found that AI Overview content changes roughly 70% of the time for identical queries, and citation patterns drift 40-60% month over month.
That's why measuring AI visibility requires a fundamentally different approach than traditional SEO analytics. You need to:
This is what we built Sill to do. Every problem described in this post maps directly to a feature we've built:
AI Visibility Reports
Get your baseline. We run 50 purchase-intent queries across ChatGPT, Perplexity, Gemini, Google AI Overviews, Copilot, and Grok, then score your brand against 18+ on-site and off-site factors grounded in peer-reviewed GEO research. You get a full competitive landscape, content audit, and prioritized action plan. Learn more about Reports.
Daily Monitoring Dashboard
Track your Share of Voice over time, not just once. See daily visibility trends, competitor rankings, sentiment analysis, and a semantic map of how AI models position you. Know the moment a model update or competitor move shifts your visibility. Learn more about the Dashboard.
Real Chat Experience, Not API Approximations
We query the actual chat interfaces with web search enabled, citations included, and geographic context applied. The scores you see in Sill reflect what your potential customers actually see when they ask an AI for a recommendation.
Research-Backed Recommendations
Every recommendation traces back to published evidence from Princeton, CMU, Berkeley, and Columbia. No guesswork. No generic advice. Specific actions ranked by impact, tailored to what actually moves the needle for AI visibility.
If you're reading this and wondering where your brand stands, you're not alone. Most marketing teams we talk to have no idea whether AI platforms recommend them or not. Here's a practical starting point:
The brands that figure this out early will have a compounding advantage. The data shows that most brands haven't started yet. That means the window of opportunity is open.
64% of brands score under 10 in AI Share of Voice. Get a complete visibility analysis across every major AI platform, with competitive benchmarks and a prioritized action plan.
Tell us about your brand and we'll be in touch to walk you through Sill.